|
| |
|
Home | Consulting | Training | Expert Witness | Failure Analysis | Design Review | Corrosion Test | Corrosion Software | Protective Coatings | Materials Selection | Cathodic Protection | >>> | |
 Corrosion Prediction Software and Corrosion Modeling Software EVS-Compass®: Extreme Value Statistics for Corrosion Modeling and Corrosion Life Prediction Version 15.2
Anytime Anywhere Any Device Any OS No USB dongles No installation No Browser Plug-ins
|
|
|
Why WebCorr |
Performance Guarantee |
Unparalleled Functionality |
Unmatched Usability |
Any Device Any OS |
Free Training & Support |
CorrCompass |
|
|
Overview and Application Examples of EVS-Compass - Extreme Value Statistics for Corrosion Modeling and Corrosion Life Prediction |
|
|
The probability of failure (POF) is an important factor in API 580 Risk-Based Inspection and API 581 Risk-Based Inspection Methodology. EVS-Compass is a powerful EVS software tool that goes beyond the prediction of the probability of failure (POF) in time (POF vs service life) and in space (POF vs area, POF vs wall-thickness), it predicts the time to FIRST leak or perforation, the number of leaks at any given time, the depth of corrosion and the number of pits exceeding the specified depth at any future time. For partial coverage inspection, EVS-Compass determines both the size and number of inspection blocks to minimize uncertainties. The unique capabilities of EVS-Compass help assets owners, operators, and government regulators make quantitative risk-based decisions pertaining to the future conditions and operations of structures and assets. EVS-Compass is a highly effective and powerful tool for the following applications: Corrosion Modeling Corrosion Life Prediction Risk-Based Inspection (API 580 Risk-Based Inspection and API 581 Risk-Based Inspection Methodology) NDT/NDE Partial Coverage Inspection (EVS Extrapolation in Space and in Time) Asset Integrity Management (such as Pipeline Integrity Management) External Corrosion Direct Assessment (ECDA) Internal Corrosion Direct Assessment (ICDA) Marine and Offshore Inspection and Assessment Above-ground Storage Tank Corrosion Inspection and Assessment Under-ground Storage Tank Corrosion Inspection and Assessment Leak Prediction for Pipelines, Vessels, Storage Tanks, Boilers, Condensers, and Heat Exchangers
EVS-Compass is a cloud-based software that works on any device running any OS without the need for users to install or download anything. Figure 1 below shows an overview of the user interface of EVS-Compass.
Figure 1 EVS-Compass: Extreme Value Statistics software for corrosion modeling and corrosion life prediction of structures and assets.
EVS-Compass: Extreme Value Statistics Software Application Example No.1 Prediction of Pitting Corrosion in Type 316L Stainless Steel: Seeing the Bigger Picture of the Distant Future -EVS Extrapolation in Space and in Time
In Figure 1 above, type 316L stainless steel coupons of 2" by 2" (4 in2= 0.00258 m2) with a thickness of 0.5" (12.7 mm) were immersed in chloride solution at 50°C for durations ranging from 49.50 hours to 528 hours (2.063 to 22 days) in the laboratory. For each exposure duration, a number of identical coupons (from 3 to 15) were used. The maximum pit depth on each coupon was measured and entered in EVS-Compass. The 5 exposure durations produced 5 datasets. For a surface area of 1 ft2 (12"x12"=144 in2=0.0929 m2), EVS-Compass predicts that: (1) the time to first leak or perforation of the 12.7 mm plate is 882 days; (2) after 11 years (4015 days), the number of leaks or perforation holes is 63 (675x0.0929=63); (3) the time to 100th leak or perforation is 8871 days (24.3 years); (4) the hole area at 11 years is 9.955% of the total surface area; (5) the depth of the largest pit at 11 years is 24.532 mm; (6) the depth of the 100th largest pit at 11 years is 8.999 mm; (7) the number of pits exceeding 0.5 mm at 11 years is 215 (2318x0.0929=215); (8) the time for the first 100 pits to exceed 0.5 mm is 5 days; (9) the probability of failure at 11 years for wall thickness of 12.7 mm is 100%; (10) the service life for wall thickness of 12.7 mm at 5% probability of failure is 170 days; (11) For partial coverage inspection (PCI), the maximum area of EVS extrapolation under the current settings is 2.01 m2.
EVS-Compass is designed with end-users in mind without the usual learning curve associated with a new software. Users simply enter the basic information such as material, service environment, area of coupons or inspection blocks, total surface area of the structure, exposure time and durations, and the maximum pit depth for each coupon or inspection block at each exposure duration. Figures 2-5 show the options for materials, service environments, exposure time, and type of charts to display.
Figure 2 Extreme Value Statistics software for corrosion modeling and corrosion life prediction of structures and assets: option for Material of Construction
Figure 3 Extreme Value Statistics software for corrosion modeling and corrosion life prediction of structures and assets: option for Service Environment.
Figure 4 Extreme Value Statistics software for corrosion modeling and corrosion life prediction of structures and assets: option for Exposure Time.
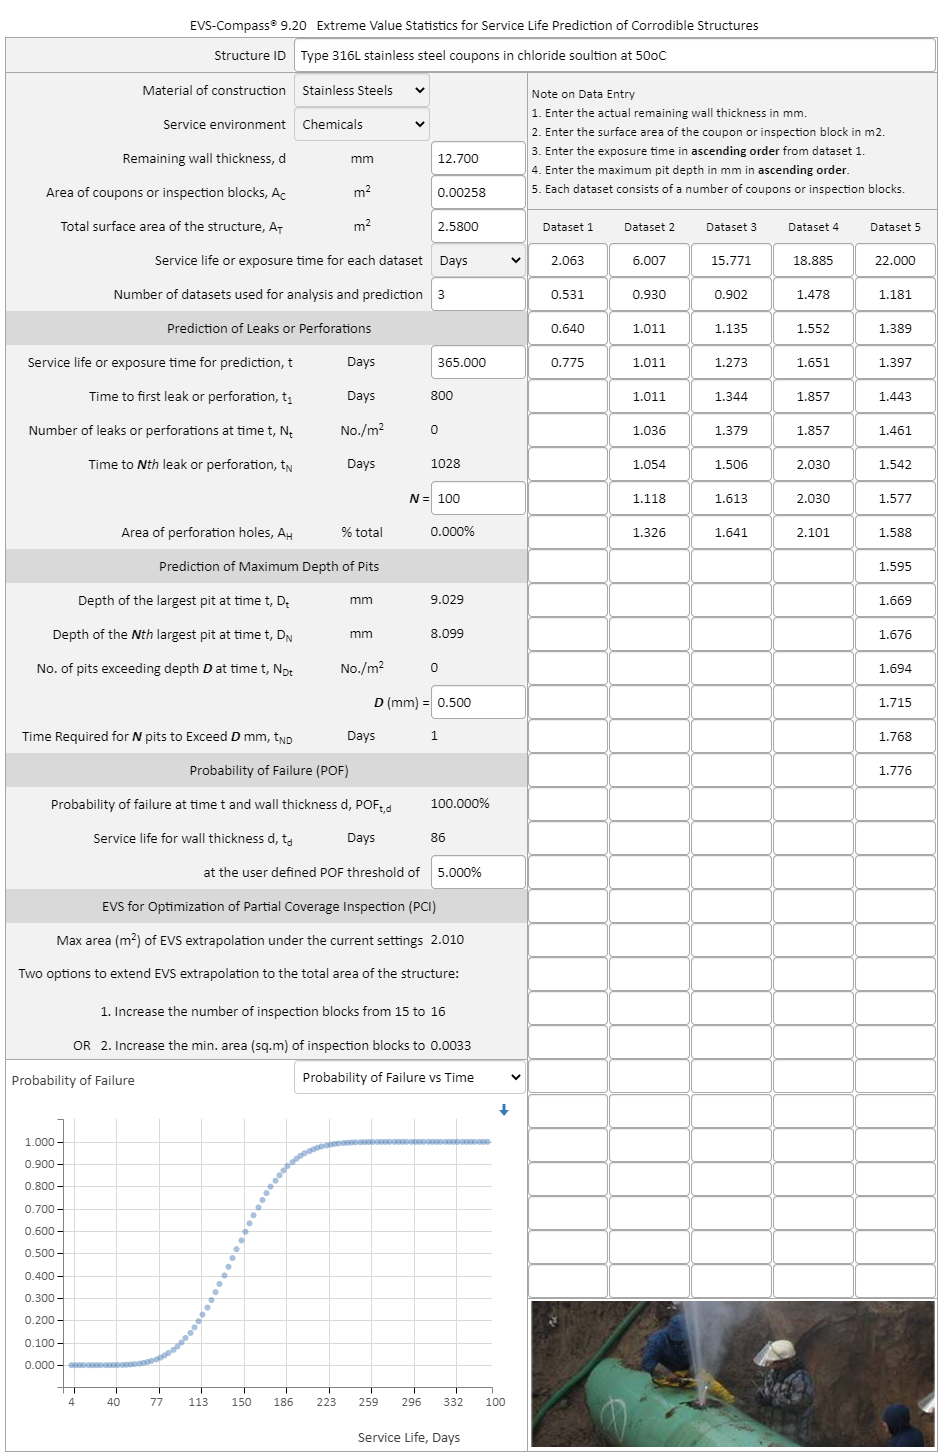
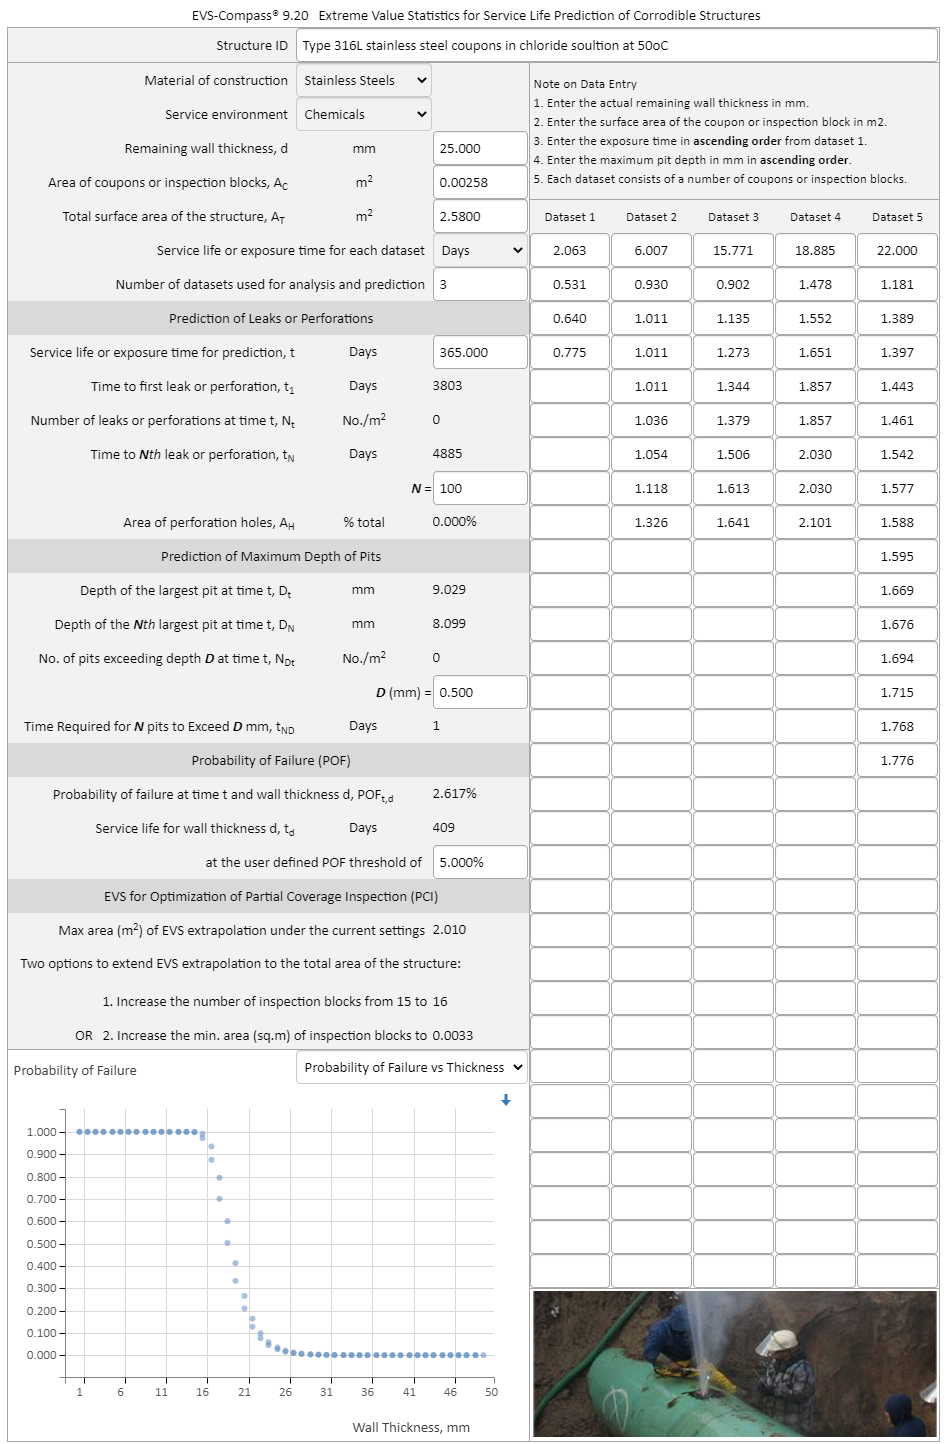
Seeing the Bigger Picture of the Distant Future -EVS Extrapolation in Space and in Time: The surface area of coupons used in laboratory tests was 4 in2 (0.00258 m2) for a maximum duration of 22 days. Figure 6 shows prediction results by EVS-Compass when the surface area is extrapolated to 2.58 m2 (1000 times) and the exposure time to 365 days. The time to first leak or perforation is 800 days, the time to 100th leak or perforation is 1028 days. For partial coverage inspection (PCI), EVS-Compass determines that the maximum surface area for extrapolation is 2.02 m2. EVS-Compass recommends two options to extend the extrapolation to the total surface area of the structure: (1) by increasing the number of inspection blocks from the current 15 to 16; or by increasing the minimum surface area of the inspection blocks from the current 0.00258 m2 to 0.0033 m2. The probability of failure vs. service life is selected in Figure 6. In Figure 7, the probability of failure vs. surface area is selected. Figure 8 show the plot of the probability of failure vs. wall thickness.
Figure 6 Extreme Value Statistics software for corrosion modeling and corrosion life prediction of structures and assets: Probability of Failure vs. Service Life.
Figure 7 Extreme Value Statistics software for corrosion modeling and corrosion life prediction of structures and assets: Probability of Failure vs. Surface Area.
Figure 8 Extreme Value Statistics software for corrosion modeling and corrosion life prediction of structures and assets: Probability of Failure vs. Wall Thickness.
EVS-Compass: Extreme Value Statistics Software Application Example No.2 Prediction of Pitting Corrosion in Aluminum Alloy: Seeing the Bigger Picture of the Distant Future -EVS Extrapolation in Space and in Time Figures 9 and 10 show another application example of EVS-Compass in corrosion modeling and life prediction. Aluminum alloy Alcan 2S-O coupons of 129 cm2 were immersed in Kingston tap water at 25°C for various durations from 7 to 365 days. Maximum pit depth on each coupon at 5 exposure durations is entered into EVS-Compass as shown in Figure 9 below. For a large structure with an area of 1000 m2 (that is 77,519 times of the area of coupons) and a wall thickness of 2.54 mm, EVS-Compass predicts that: (1) the time to first leak or perforation is 991 days; (2) the number of leaks or perforation after 5 years (1825 days) is 24/m2; (3) the time to the 100th leak or perforation is 997 days; (4) the hole area after 5 years exposure is 21% of the total surface area; (5) the depth of the largest pit on the 1000 m2 surface area after 5 years is 3.09 mm; (6) the number pits exceeding 1.27 mm after 5 years is 108/m2; (7) the time required for the first 100 pits to exceed 1.27 mm is 98 days; (8) the probability of failure at 5 years for the wall thickness of 2.54 mm on the 1000 m2 surface is 100%; (9) the service life for the wall thickness of 2.54 mm in the 1000 m2 surface is 3 days at the POF of 5%; (10) for partial coverage inspection, the maximum area of extrapolation is 0.809 m2; (11) EVS-Compass recommends two options to extend EVS extrapolation to the entire surface area of the structure: (a) by increasing the number of coupons or inspection blocks from the current 10 to 32; (b) by increasing the area of coupons or inspection blocks to 15.9438 m2 (shown in Figure 10 below); (12) the maximum pit depth vs. service life is plotted in Figure 9.
Figure 9 Extreme Value Statistics software for corrosion modeling and corrosion life prediction of structures and assets: aluminum alloy in Kingston tap water.
Figure 10 Extreme Value Statistics software for corrosion modeling and corrosion life prediction of structures and assets: Optimization of Partial Inspection Coverage
EVS-Compass: Extreme Value Statistics Software Application Example No.3
Partial Coverage Inspection of Pitting Corrosion in Oil Tank Bottom Plate:
Seeing the Bigger Picture - EVS Extrapolation in Space
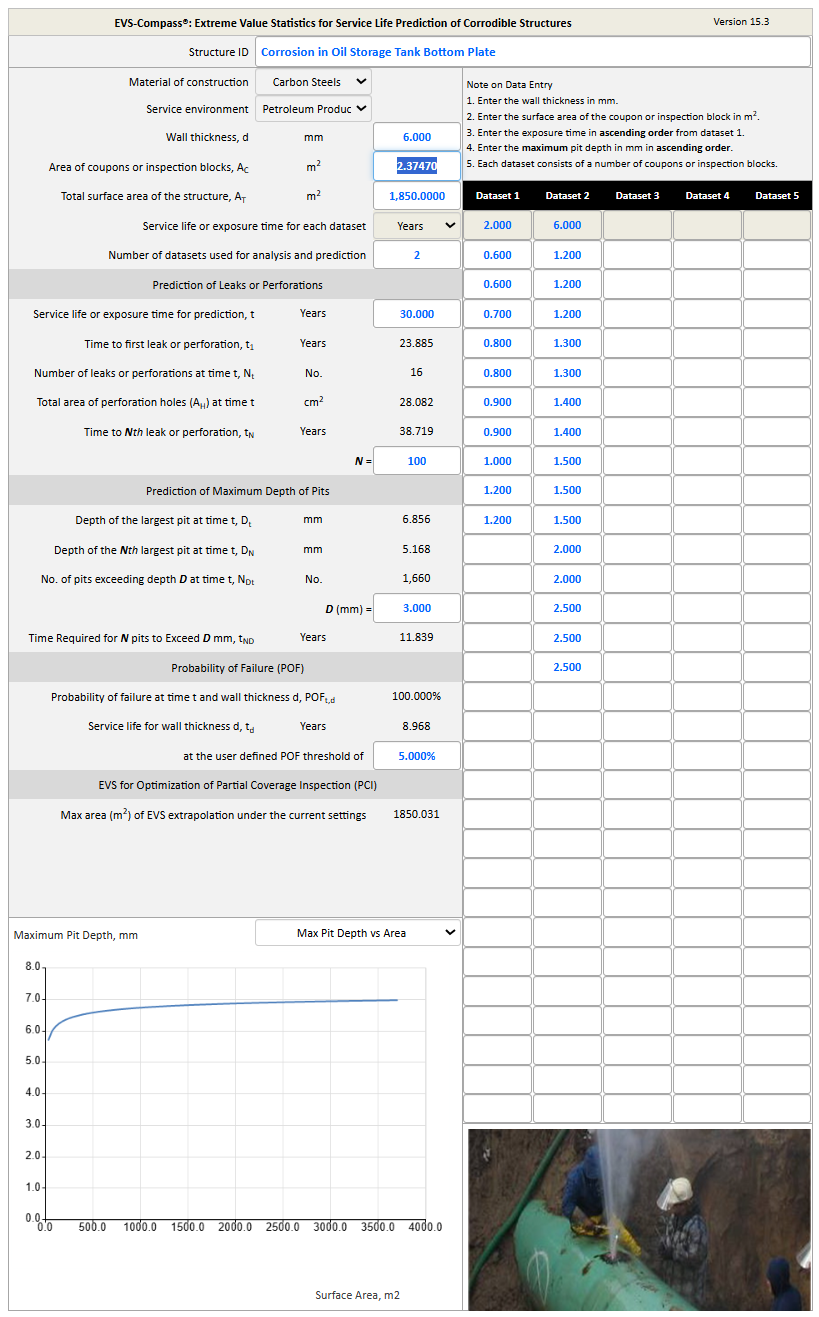
Inspection of a large oil tank carbon steel base plate of 6 mm in thickness was carried out to determine the maximum pit depth distribution. The whole surface area of the oil tank plate was 1850 m2. Due to time, cost, and accessibility considerations, partial coverage inspection using
inspection blocks of 1.85 m2 each was randomly selected for pit depth measurements. The maximum pit depth on each of the inspection blocks was entered into EVS-Compass. Based on the maximum pit depth data measured using small inspection blocks of 1.85 m2, EVS-Compass predicts that
(1) the time to first leak in the 1850 m2 base plate is 23.621 years (Figure 11a); (2) there will be
21 leaks at the age of 30 years; (3) the time to 100th leak is 37 years;
(4) the total area of perforation holes at 30 years is 28.082 cm2.
Under the optimization for partial coverage inspection, EVS-Compass determines that (1) the maximum surface area for EVS extrapolation under the current setting is 1441.259 m2; there are two options to extend EVS extrapolation to the total area of the structure.
Figure 11b shows that when the surface area of inspection block is
increased to 2.3747 m2, EVS extrapolation is extended to the
total surface area of the tank bottom plate (1850 m2).
Figure 11a EVS-Compass predicts pitting depth in a large oil tank base plate of 1850 sq.m surface based on the partial coverage inspection.
Figure 11b Optimization of Partial Coverage Inspection with EVS-Compass
Software (Inspection block area increased to 2.3747 m2).
EVS-Compass Extreme Value Statistics Software Application Example No.4
Pitting Corrosion of Carbon Steel in Natural Seawater: Seeing the
Bigger Picture of the Distant Future -EVS Extrapolation in Space and in Time
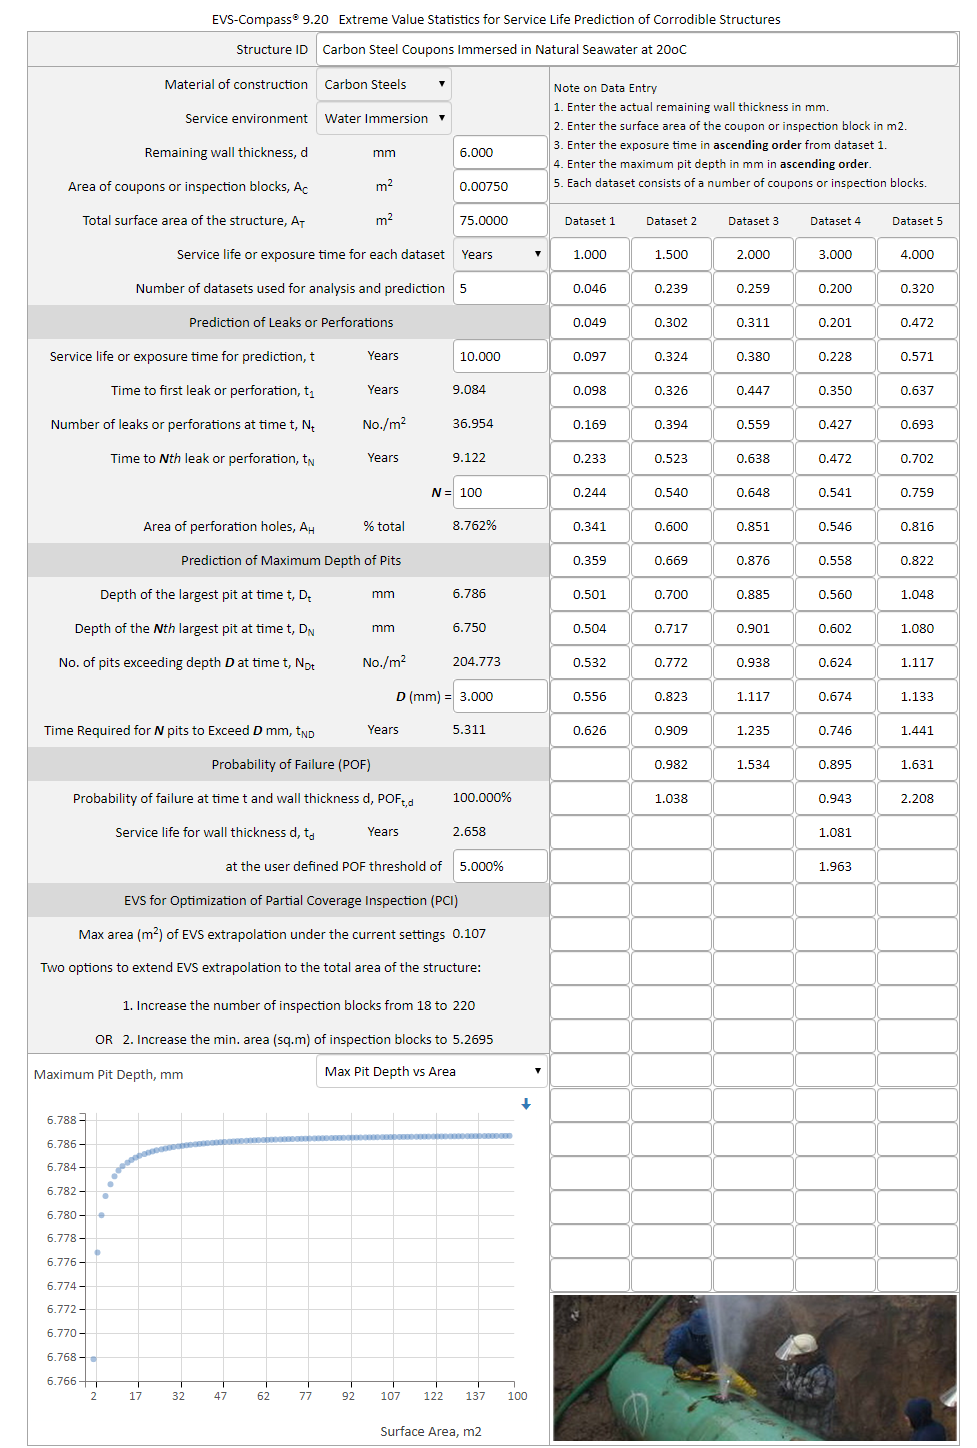
Carbon steel coupons of 75 mm x 50 mm were immersed in natural seawater for durations of 1.0, 1.5, 2.0, 3.0 and 4.0 years. Maximum pit depth for each coupon at each exposure duration is entered into EVS-Compass (Figure 12). Note that the surface area of a coupon (with 2 sides) is 0.0075 m2 (75 cm2). EVS Extrapolation of the pit depth to a surface area of 75 m2 (10000 times of the coupon area) and the future time of 10 years produces the following results:
(1) the time to first leak or perforation is 9.084 years;
(2) the number of leaks or perforation at 10 years is 2772
(75x36.954);
(3) the time to 100th leak or perforation is 9.122 years;
(4) the hole area at 10 years is 8.762%;
(5) the time required for 100 pits to exceed 3 mm depth is 5.311 years;
(6) the depth of the largest pit at 10 years is 6.786 mm;
(7) the depth of the 100th largest pit is 6.75 mm;
(8) the number of pits exceeding 3 mm depth at 10 years is 15358 (75x204.773);
(9) the probability of failure at 10 years and 6mm thickness is 100%;
(10) the service life for wall thickness of 6 mm at POF of 5% is 2.658 years
Figure 12 EVS-Compass predicts pitting corrosion of carbon steel in natural seawater with EVS extrapolation in space and in time.
The powerful applications of EVS-Compass are truly unlimited in engineering design, materials selection, process operation, inspection and maintenance, corrosion modeling and corrosion life prediction of structures and plant assets.
Click here to contact us for licensing details and experience the power of EVS-Compass. |
|
EVS-Compass, giving you the right directions in Corrosion Modeling and Life Prediction of Structures and Plant Assets |
|
|
Home | Contact Us | PDF |
Copyright © 1995-2026. All rights reserved. |


 Extreme value statistics (EVS) has been used since the 1950s for extrapolating corrosion damages (maximum pit depth, crevice depth, crack depth etc.) from small lab samples, field coupons, or partial coverage inspection blocks to larger area of structures and assets at present or future times. WebCorr's EVS-Compass is the only device and OS independent EVS software on the market for corrosion modeling and life prediction of corrodible structures and industrial assets. FEED designers, engineers, consultants, maintenance and inspection personnel, asset owners and operators, and government regulators can quickly and accurately determine:

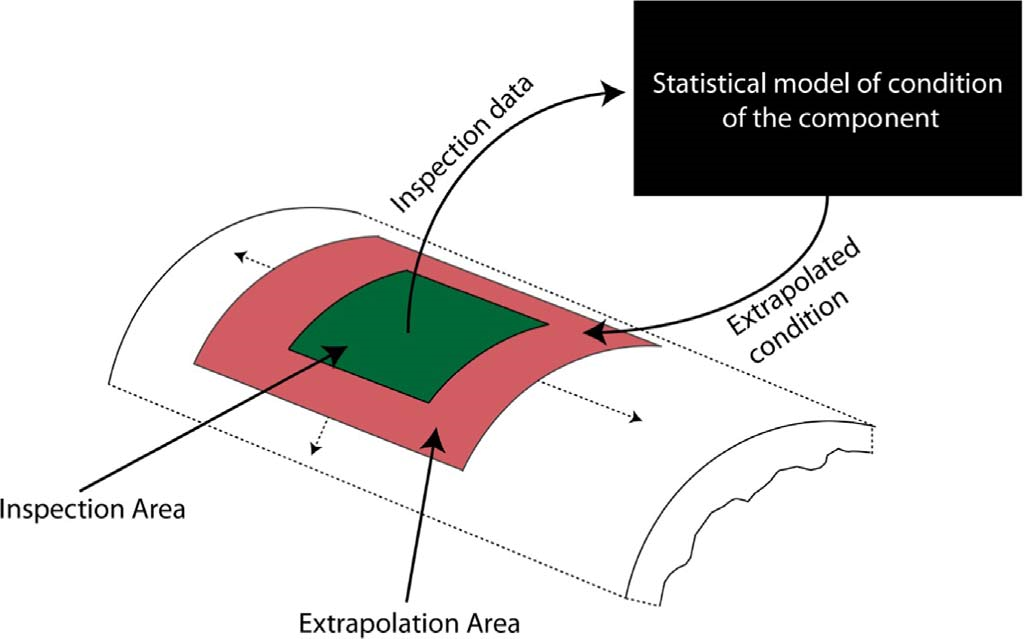
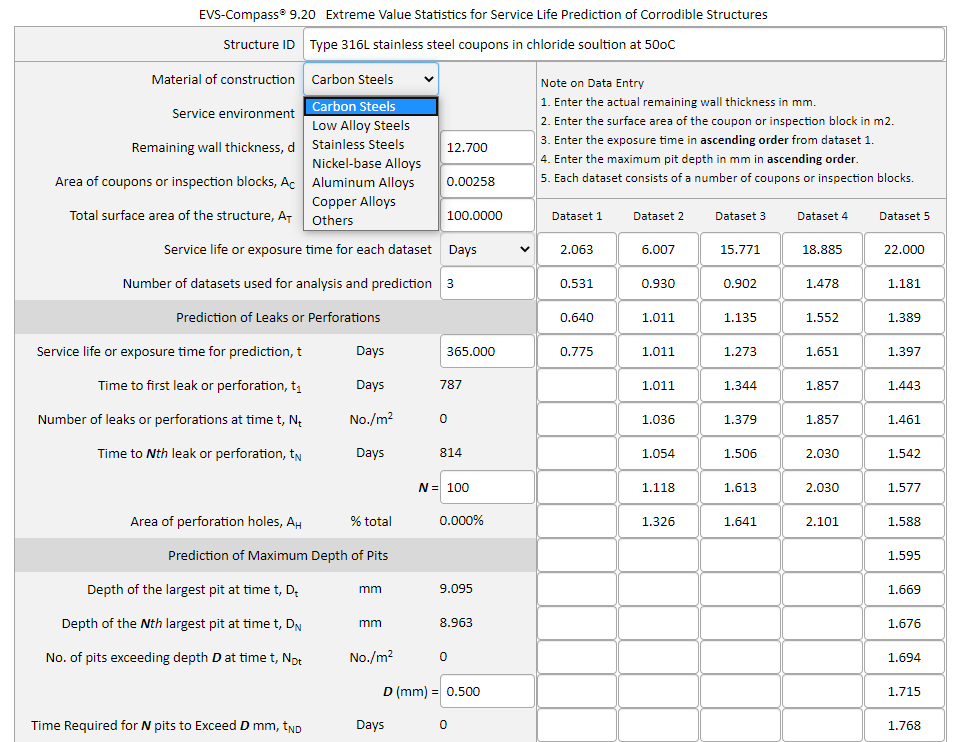
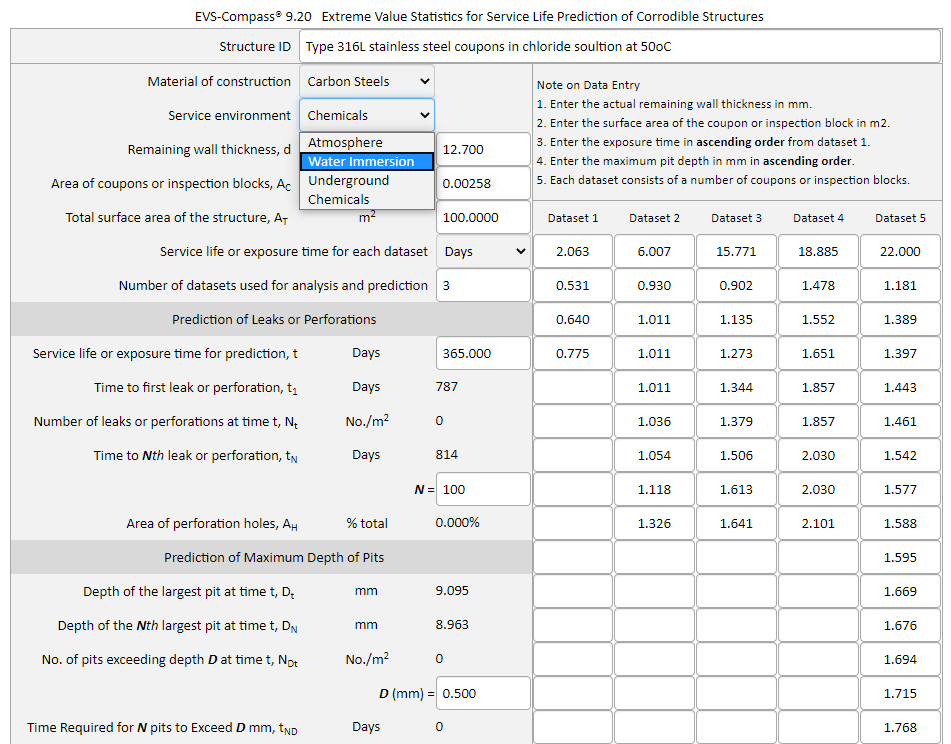
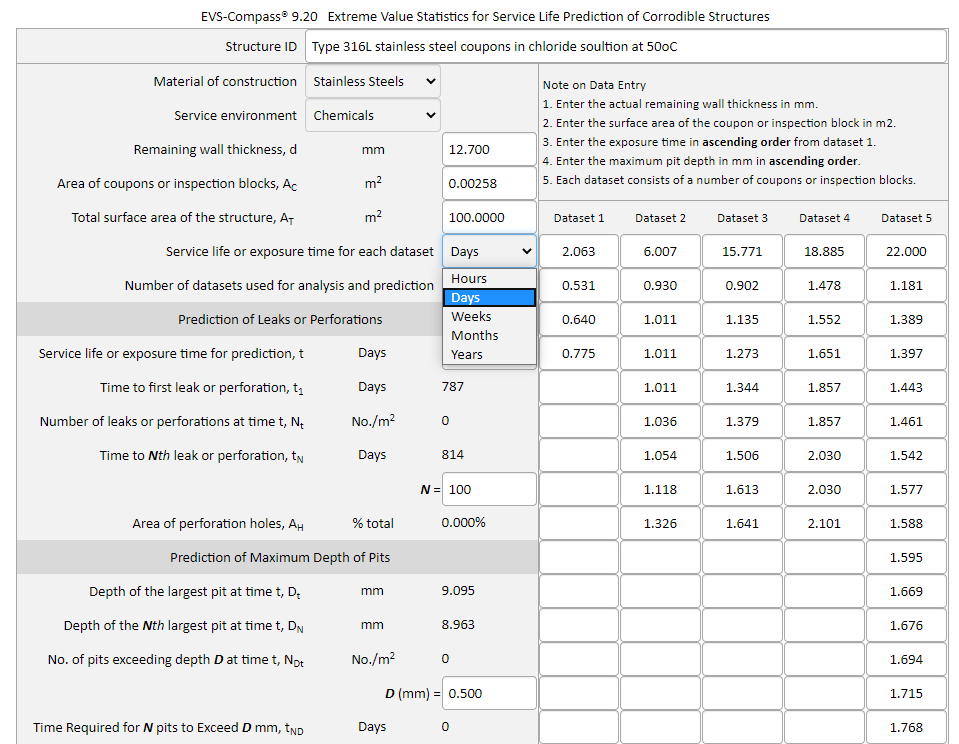
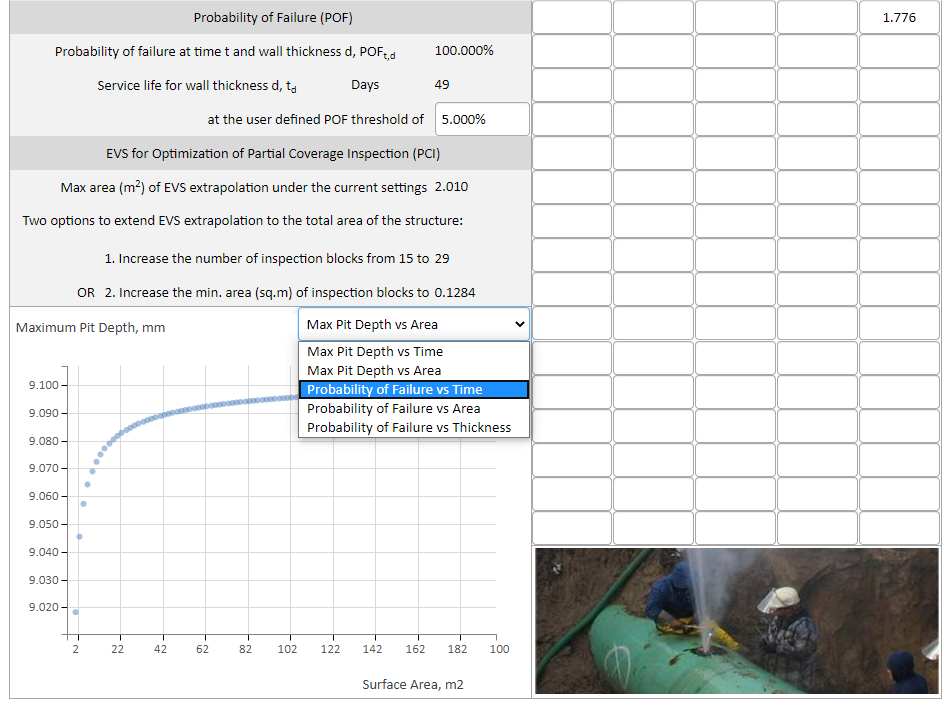 Figure 5 Extreme Value Statistics software for corrosion modeling and corrosion life prediction of structures and assets: option for different types of plots.