Lecture 7: Theory for Aqueous Corrosion (V)
[Previous Lecture] [Next Lecture] [Course Outline] [General Info]
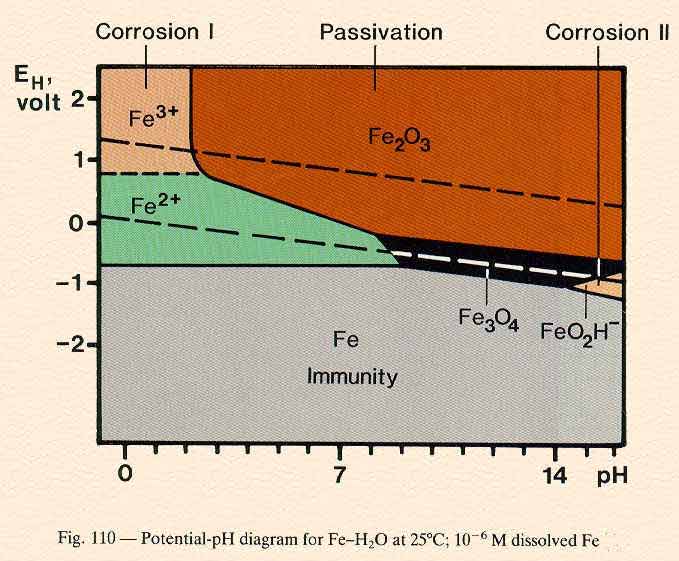
4.10 POTENTIAL-pH DIAGRAMS
Also called POURBAIX DIAGRAMS
are charts based on thermodynamic calculations that can be used to distinguish a corroding condition from a non-corroding condition.
CORRODING CONDITION: [Mn+] > 10-6 M
IMMUNITY CONDITION: [Mn+] < 10-6 M
Possible regions of a E-pH diagram: immunity, corrosion or passivation.
Each domain indicates a region in which one species is the most thermodynamically stable. If the metal is the most stable species then it is considered immune to corrosion, but if a soluble ion is most stable then the metal should corrode. A region in which an insoluble corrosion product is the most stable species is considered passive.
Calculation and Construction of E-pH diagram
- Identify all possible chemical and electrochemical reactions in the given system
- Apply Nernst equation to each possible reaction
- Make use of equilibrium constant if necessary
- Determine the relationship between between the potential (E) and the pH of the system
- Draw the potential as a function of pH in a chart
- [Mn+]=10-6 M is assumed as borderline for corrosion and non-corrosion region
- The chart is divided into different region representing different corroding conditions
Application and Limitation
It is the E-pH diagram that made the study of corrosion a reputable science. Its applications include:
- Formulation of corrosion control methods (use of cathodic protection, anodic protection, corrosion inhibitors etc.)
- Identification of possible corroding states of the metal-H2O system (regions of immunity, passivation, corrosion or cracking)
- Prediction of most likely corrosion products (Fe2+ or Fe3+ ?) for the metal-H2O system
- Others
Practical limitations in the use of E-pH diagram are:
- E-pH diagram is based on thermodymanic calculations at assumed standard condition
- It is for pure metal in pure water system
- No kinetic information is given
- Effect of other ionic species such as Cl- is ignored
- Effect of flow or velocity on the stability of passivity is not taken into account
Summary
E-pH diagram is a very useful chart that maps out the different regions of a corroding system. These possible regions are immunity, corrosion, passivation or cracking. It can be used to formulate corrosion control methods and to predict the possible corrosion products. However, its practical application is limited by its lack of kinetic information and thermodynamic nature of origin.
To reinforce learnings in this lecture read pages 106-110
(textbook)
To prepare yourself for the next lecture
read pages 130-143 (textbook)
Copyright © 1995-2024. All rights reserved.